What started as a mere idea out of the turmoil of catching a cab, is now famously known as Uber.
In this article, we will be discussing some Uber Statistics 2019-2020 and see how it is impacting the lives of the people across the globe.
Though the birth of the idea happened in Paris 2008, the company itself was established in San Francisco, a year later. Since then, the transportation system has never been the same.
Table of Content:
1. Uber Revenue count in 2018 reached $11.3 billion
2. Uber’s Net Annual Revenue in Q2 2018 was estimated to be $2.7 billion
3. Gross bookings for 2018 were $12 billion
4. Estimated Worth of Uber is $90 billion
5. Ridesharing Market Share of Uber is higher than its competitors
6. UberEats estimated revenue is $10.8 million
7. Uber has an impressive number of Riders
8. Uber has 3.9 million drivers around the world
9. Uber reported “Monthly Active Platform Consumers” or “MAPCs” of 91 million in 2018
10. You can enjoy Uber services in 63 countries and more than 700+ cities
11. Average Cost of Uber for a 5.5-mile ride in 5 states is less than its competitors
12. Uber App downloads reached 6.4 million in the US in Q1 2019
13. UberEats delivered over 15 million meals in the fourth quarter of 2018
14. 40.9% of Uber’s workforce was Female
15. The Uber Driver demographic for females is 14%
16. 15 million Uber trips are completed each day globally
17. 58.7% drivers primarily drive for Uber exclusively
18. 46% of Uber drivers have been there for less than 1 year
19. 11% of Uber drivers have been there for three years or more
20. Uber drivers earned $600 million in tips in the first half of 2018
21. The Age range of Uber drivers is highly diverse
22. Gross hourly earnings of 18 to 30 years old Uber Drivers is $17.98
23. Uber had 41.8 million active users in the US as of March 2018
24. Uber has 91 million monthly active users globally
25. Uber users count estimated to reach 539 billion by 2021
26. UberEats National Food Delivery Market share grew by 21.44% in March 2018
27. Uber completed 10 billion uber trips in July 2018
28. The most forgotten item in an Uber was the Phone
29. The average Uber price is $1 per mile across the world
30. 8% of online adults are using Uber at least once a month
31. There are 22,000 employees at Uber
32. Toyota invested $500 million in Uber in 2018
33. 25% of Americans use Uber at least once a month
34. Uber Freights earned $359 million in Gross Bookings
35. 84.8% of Uber drivers are 41+ years old
Uber Technologies Inc. offers services like peer-to-peer ridesharing, ride service hailing, bicycle sharing system and also food delivery. It is based on the On-demand app development model.
Uber is mainly renowned for its ridesharing service and has changed the way people used transportation for better. Finding a cab seemed like a hectic job before the advent of Uber; however, now you can book a cab with a click.
Isn’t it what we all were wishing for? An on-demand ridesharing facility!
Uber does not stop at just this but is adamant on launching its Uber air on-demand helicopter service. Moreover, it has recently added eScooter and Dine-in features to its app for the US locals, which will make users all the more engaging on Uber’s app. It is expeditiously becoming a one-stop solution, one of a kind app.
Now, we know that Uber has many competitors playing in the same field. So how will we know which is the best bet? For this exact purpose, we have gathered legit Uber statistics 2019-2020 to prove the ever-increasing popularity and demand for Uber.
Also, if you are someone who has been wanting to develop an app similar to Uber, it will be good for you to know some prominent features and Uber growth statistics to make an informed decision then.
The uprising value of Uber cannot be dismissed as a mere coincidence; which is why we have procured some interesting and credible statistics on Uber from legitimate sources.
These Uber growth statistics will help you get a more lucid view on how this ridesharing, ride-hailing, and food delivery service provider is climbing the stairs to success each year. So, without any further ado, let’s buckle up and get onto the ride to the Uber Statistics world.
1. Uber’s Revenue count in 2018 reached $11.3 billion
It is no news that Uber’s popularity is growing by the day. It is due to its remarkable services and products like its flawless app that enabled Uber annual revenue to reach the milestone of $11.3 billion. There may be some fluctuations in this number in the coming years; however, the sun seems to shine on Uber’s land in the future as well.
2. Uber’s Net Annual Revenue in Q2 2018 was estimated to be $2.7 billion
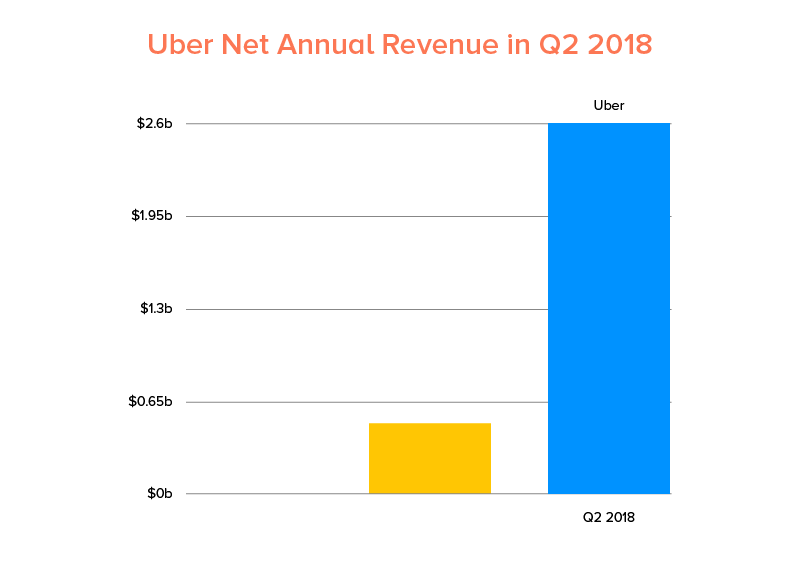
Uber’s sales growth had been continuously growing. Uber’s Q2 2018 net revenue was $2.7 billion — a growth percentage of 51% from the same quarter of last year.
3. Gross bookings for 2018 were $12 billion
The Gross bookings for Uber in 2018 were noted to be $12 billion. This also seems to increase by 41% year-over-year validating the fact that Uber is indeed on the path of success.
4. Estimated Worth of Uber is $90 billion
According to the reports by BBC, as of April 2019 Uber estimate worth $90 billion. This displays the expeditious yet continuous growth of Uber as a ridesharing and ride-hailing service provider.
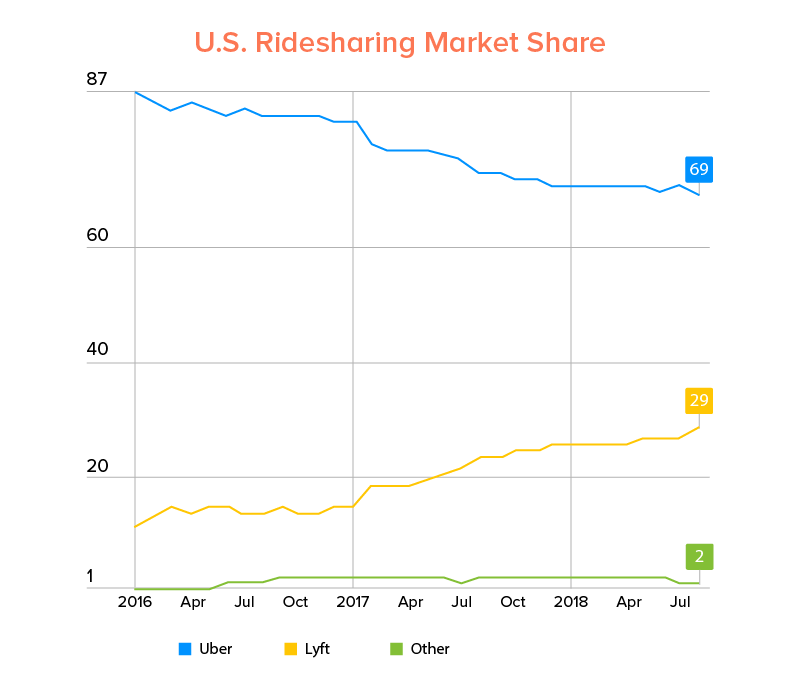
5. Ridesharing Market Share of Uber is higher than its competitors
The market share of Uber keeps on changing every year. In a report of 2018 by CNBC, the current market share of Uber is said to be between 65% and 69% as shown in the graph below. One of the biggest Uber competitors in the US, Lyft, ended up owning only 29% of market share and only 2% is estimated to belong to others.
However, tracking this industry is not an exact science; it is so because some drivers drive for both Uber and Lyft. And this makes the exact estimation of market share a little misleading.
6. UberEats estimated revenue is $10.8 million
Uber started its UberEats service in 2014. As of 2019-2020, it’s estimated revenue amount is $10.8 million. Though it is not as big a number as one might have hoped for; it is certainly going to increase in the coming years, given its growing consumer-base and popularity. In Fact, UberEats was the most downloaded food delivery app in 2018. So, we can already see how it is also going to rule the food delivery domain.
7. Uber has an impressive number of Riders
According to Uber Newsroom’s reports, Uber riders reached 75 million. With the Uber’s expansion to numerous countries, this number will inevitably increase.
8. Uber has 3.9 million drivers around the world
There are 3.9 million Uber drivers globally. Due to the pay, services, facilities, and opportunities provided by Uber, more and more drivers are registering themselves with it each day, hence, increasing this number per year, as per the Uber Newsroom’s reports.
9. Uber reported “Monthly Active Platform Consumers” or “MAPCs” of 91 million in 2018
In the fourth quarter of 2018, Uber said to have 91 million active consumers, according to CNBC reports. These are the users who take if not more, then at least one ride on Uber or buy at least one meal on UberEats. Uber’s MAPC was up 35% from the year before.
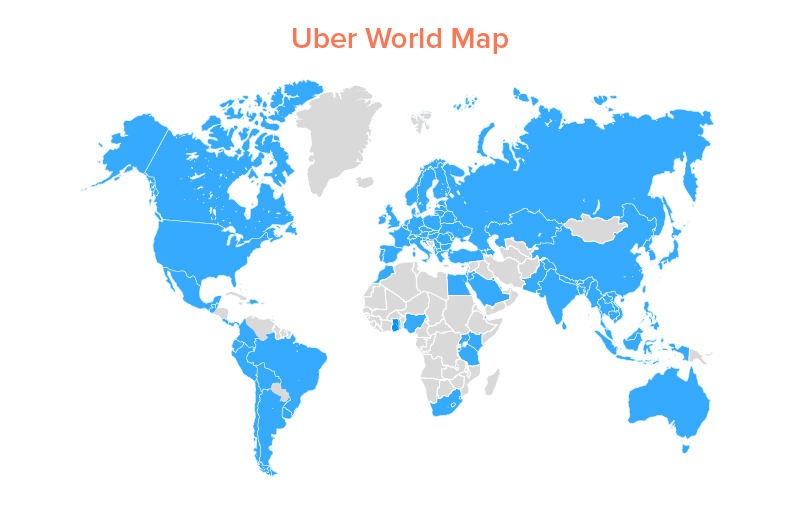
10. You can enjoy Uber services in 63 countries and more than 700+ cities
If you were wondering how many countries does Uber operates in then, let us tell you that according to Uber’s official facts and figures 2018, its services are now available in 700+ cities across 63 countries in the world.
Being a globally accepted and loved service provider company, we can expect it to expand to the rest of the countries in the coming years.
11. Average Cost of Uber for a 5.5-mile ride in 5 states is less than its competitors
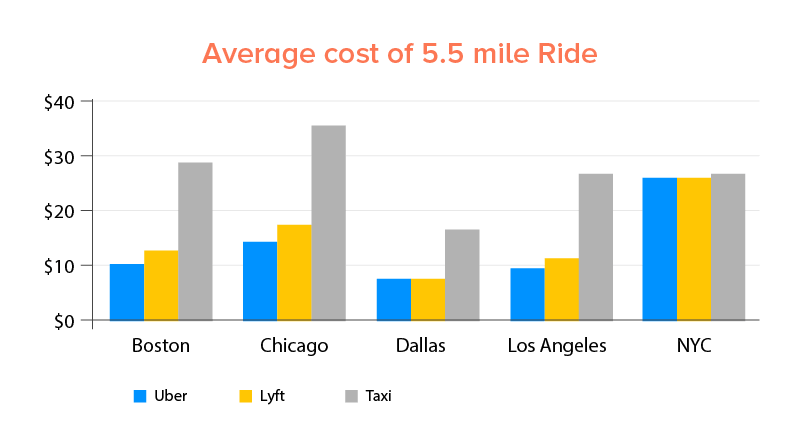
As you can see in the graph above, Uber cost estimate is cheaper across the board for the most part and is significantly less expensive than others in some cities.
Although, you should bear it in mind that this information analyzed UberX, which is economical to travel. The pricing for other Uber services, such as UberSELECT, UberXL, or UberBLACK will be more costly.
Between cities like Boston, Chicago, Dallas, Los Angeles, and NYC, we can see that in the first four cities, the Uber estimate cost is between $5 and $20, whereas in NYC it is $30, levelling with its competitors.
So the fact that Uber has been able to offer its services which are better than the competition, at a lower rate, is one of the reasons why it has been so successful.
12. Uber App downloads reached 6.4 million in the US in Q1 2019
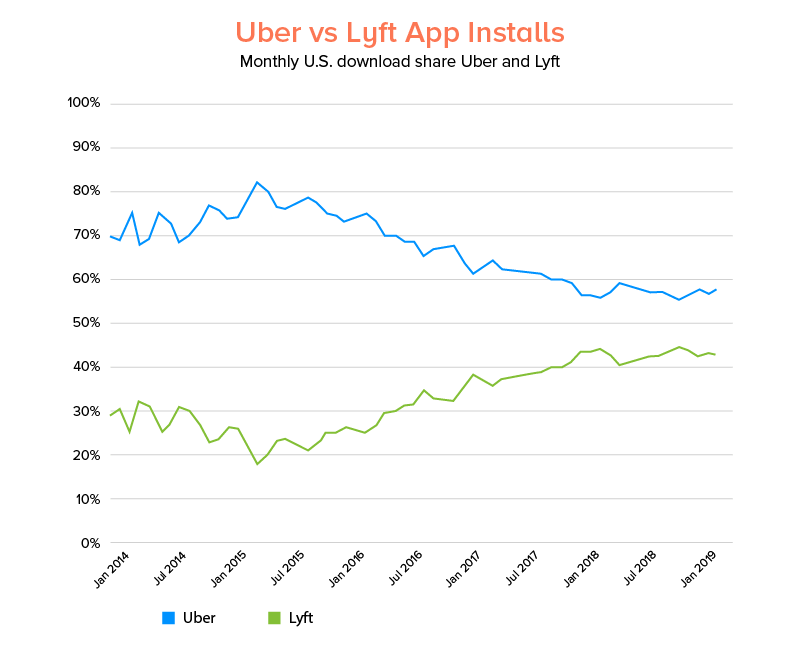
As you can see in the graph, Uber had 6.4 million U.S. installs in Q1 2019 equalling 57% as compared to a 43% download count for Lyft amounting to 4.7 million, according to Sensor Tower report.
This shows, that though Uber is facing a hard competition with its rival service provider, it is nevertheless at the top in 2019-2020 just like it had been since its first launch. It is conjectured that it requires certain actionable ways to design an app like Uber, which is flawless in every aspect.
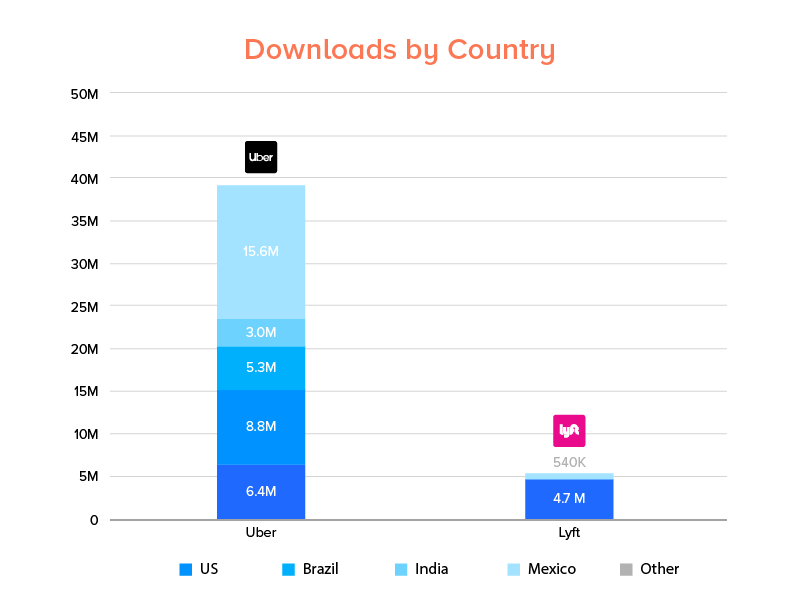
As per the Uber app download statistics, you can straight away surmise that Uber’s overall download count, in countries like the US, Brazil, India, Mexico, and others, is approx 39.1 million, if you look at the graph above.
We can see Brazil is with 22% of the overall downloads, followed by the US with 16%, India with 13% and at last Mexico with 8%.
On the contrary, Lyft is majorly limited to the US amounting to 4.7 million downloads.
13. UberEats delivered over 15 million meals in the fourth quarter of 2018
As per the report, UberEats delivered approx 15 million meals in the Q4 2018. This is pretty impressive as it is not that old in the market, yet is killing the food delivery game.
14. 40.9% of Uber’s workforce was Female
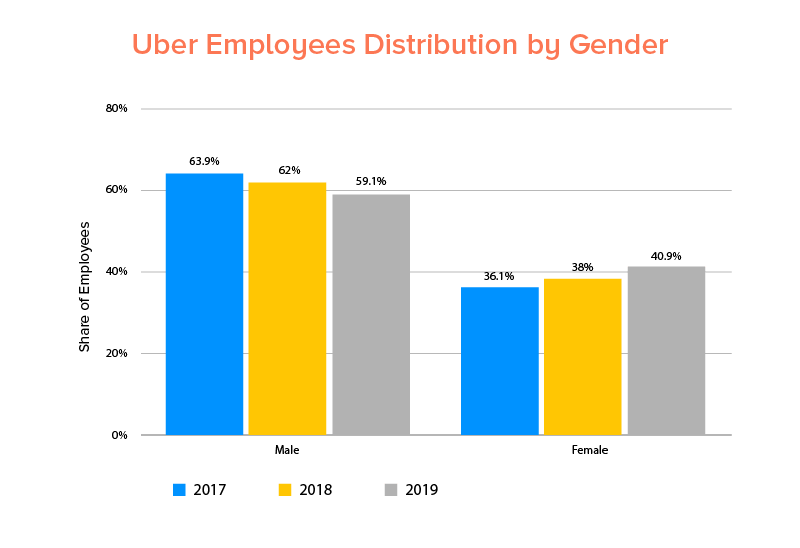
According to Statista’s study, the involvement of both genders in the Uber transportation company was evident in the last three years. Speaking of female demographic in the Uber employee sector, it keeps on increasing year by year, as shown in the graph above.
It was noted that in the year 2017, there were 36.1% of females working in the company, which in 2018 increased to 38% and is currently 40.9%.
This continuous hike in the percentage is evidence of the inclusion of both genders by Uber and shows how opportunities are provided to everyone.
15. The Uber Driver demographic for females is 14%
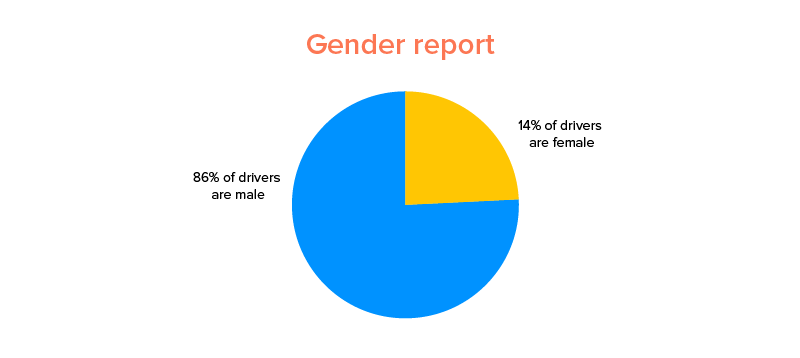
As compared to the employee percentage of females in Uber, the percentage of female drivers in Uber is 14%. Though it may not sound like much, however, Uber is slowly and steadily becoming a working domain for all genders, making unrestrained entry of everyone.
16. 15 million Uber trips are completed each day globally
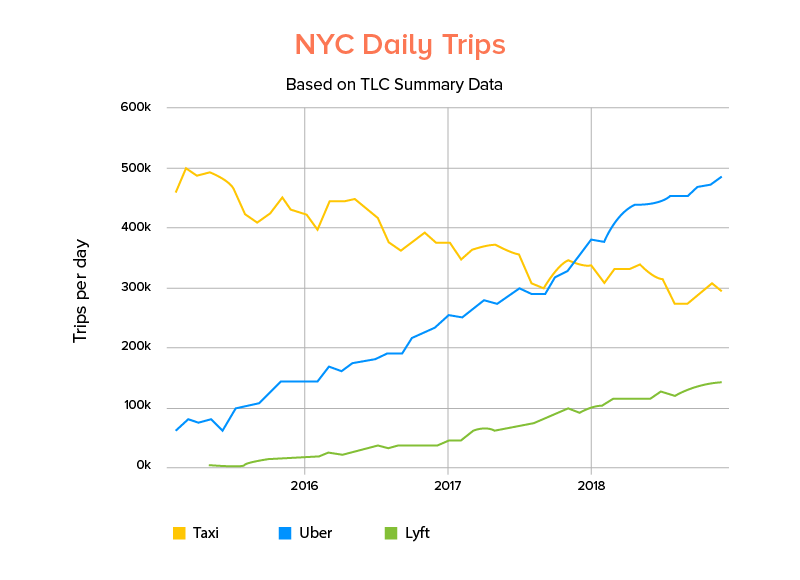
Uber has established itself as the major ridesharing service provider not just in the US but globally. This global presence has rendered Uber to reach a huge amount of 15 million trips every day adding to Uber’s massive annual revenue collection and making it the most successful ridesharing and ride-hailing app, according to Vox.
In a report by Todd Schneider on Uber Usage in New York City, we found that Uber’s daily count had been increasing since 2016. As of Q1 2019, it is at the highest as you can see in the graph given above. On the other hand, Taxi is the most affected service by the uprising of Uber and it is certainly evident in this graph.
17. 58.7% drivers primarily drive for Uber exclusively
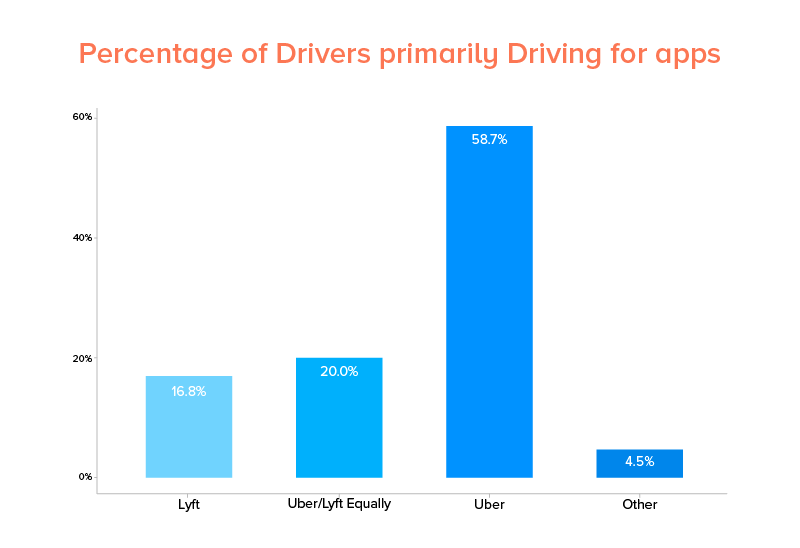
Uber’s business and revenue model is not only based on its riders but also the drivers. So, this makes it highly prominent for Uber to cater not just customers but also take drivers’ needs into consideration. Due to their impressive steps towards the inclusion of Driver’s needs and their problems into perspective, 58.7% of drivers across the US, as shown in the graph, prefer Uber as their primary platform.
18. 46% of Uber drivers have been there for less than 1 year
As per Uber driver statistics, 46% of Uber drivers have been on the platform for less than a year. This represents the want among the people to work with Uber.
19. 11% of Uber drivers have been there for three years or more
According to Uber driver demographics, there are only 11% of drivers who have been driving for Uber for more or less three years.
20. Uber drivers earned $600 million in tips in the first half of 2018
It doesn’t seem preposterous now that Uber drivers asked for the in-app tips feature, is it? Since the addition of this feature, Uber drivers managed to earn $600 million as tips in just the Q4 of 2018.
It has helped a lot of the drivers in receiving a handsome amount of money in exchange for their magnificent services. It also shows that more and more people have started to tip Uber drivers.
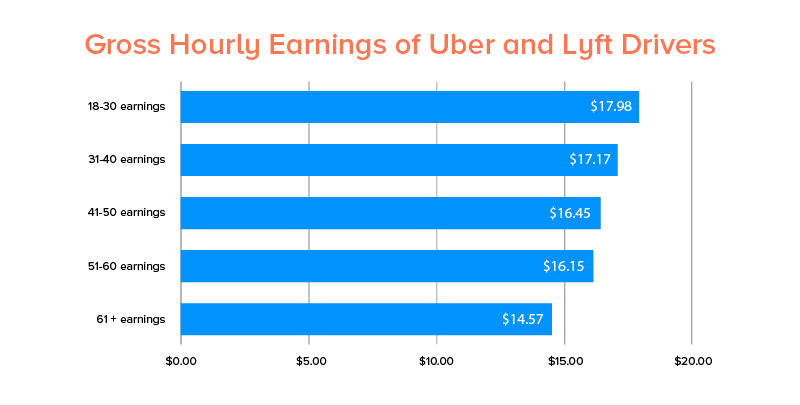
21. The Age range of Uber drivers is highly diverse
As shown in the graph below, the Uber driver demographic ranges from 18 to 61+ years. Now, the hourly earnings rate may vary slightly depending on numerous conditions. However, here we are only addressing the average rate.
22. Gross hourly earnings of 18 to 30 years old Uber Drivers is $17.98
It is evident from the graph above that drivers of the age group 18- 30 years earn the highest being $17.98 per hour, followed by the age group 31-40 earning $17.17 p/h. Then comes the 41-50 age group with hourly earnings of $16.45. The drivers of 61+ age only make $14.57 per hour. This stat is predicted to change with the increase in the earnings since Uber is becoming popular by the day.
23. Uber had 41.8 million active users in the US as of March 2018
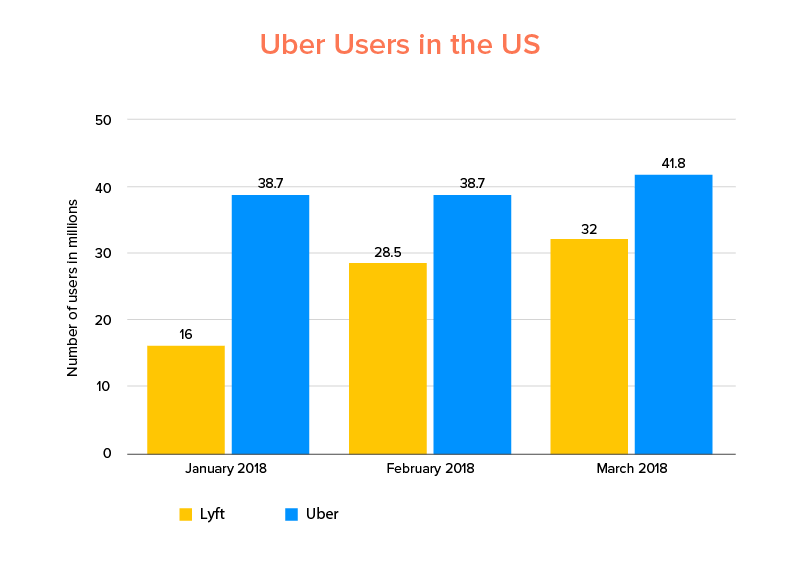
As shown above, the Uber active users were estimated to be 41.8 million in March 2018. This number rose from the initial amount of 38.7 million in January and remained constant throughout February; however, Uber experienced an unspeculative rise in March.
If we look at Lyft, the numbers are significantly less than the Uber’s, however, there is a continuous rise whatsoever.
24. Uber has 91 million monthly active users globally
Uber is becoming a ride-hailing and ridesharing business giant across the globe. On analyzing this popularity, it was estimated that the Uber monthly active users count is 91 million.
25. Uber users count estimated to reach 539 billion by 2021
Uber consumer demographic is likely to reach 539 billion by the year 2021 seeing the increasing demand for Uber. This number is not going to stop as far as we can see.
26. UberEats National Food Delivery Market share grew by 21.44% in March 2018
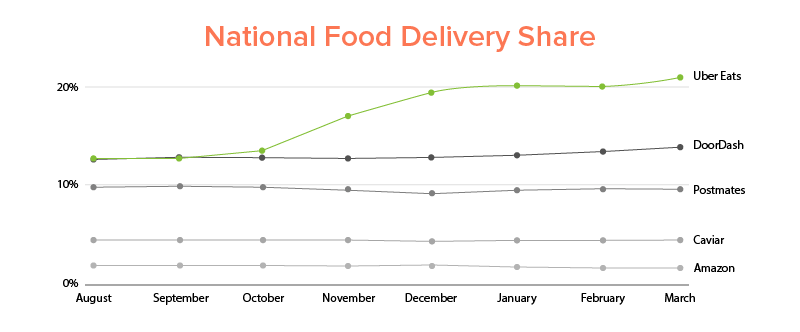
As per the reports by Vox, the national food delivery market share of Uber grew by 21.44% in March 2018. This statistic is enough to validate the statement that UberEats is going to grow in the coming years.
27. Uber completed 10 billion uber trips in July 2018
Due to its global presence, Uber managed to complete its 10 billionth ride in July 2018. This count has surely increased in 2019 and will be greater than ever by the end of 2019.
28. The most forgotten item in an Uber was the Phone
Uber claimed that the most forgotten item in an Uber was the Phone. For this particular problem, they have come up with many reliable solutions, because it is highly prominent for any organization to build trust in their customers.
29. The average Uber price is $1 per mile across the world
The average price for an Uber ride is estimated to be $1 per mille, which is the standard rate for all the countries Uber serves in. On observing, this price is low as compared to Uber’s competitors.
30. 8% of online adults are using Uber at least once a month
It is noted that 8% of overall online adult demographic use Uber at least once a month. The ever-increasing popularity for on-demand transportation service is evident by these statistics.
31. There are 22,000 employees at Uber
According to Uber, they have approximately 22,000 employees working with them. With the rising popularity and expanding business, this statistic is bound to rise.
32. Toyota invested $500 million in Uber in 2018
Seeing the rising demand for Uber, Toyota has invested a hefty amount of over $500 million in 2018. This investment for sure will prove profitable.
33. 25% of Americans use Uber at least once a month
Now that the US is the home country of Uber, it has a stronghold over the transportation needs and preferences of the users. This is the reason why 25% of Americans use Uber once a month, if not more.
34. Uber Freights earned $359 million in Gross Bookings
Uber Freights Gross bookings count is estimated to be $359 million. It goes without saying that this number is bound to increase with its increasing popularity.
35. 84.8% of Uber drivers are 41+ years old
After analyzing the Uber driver statistics mentioned above, we all know that Uber drivers demographic is very dynamic. With that said, it is estimated that 84.8% of drivers are 41+ years old, emphasizing the fact that many people’s livelihood depends on Uber.
Once you go through these Uber statistics 2019-2020, you would find yourself convinced of the rising splendour of Uber globally. While the popularity of the ride-sharing industry’s leader is majorly owed to its activeness in making its services reliable and safe, convenient features that it comes adorned with always plays a major role in shaping its growth story.
Do you wish to join the growth trend Uber is on? Know how much Uber like app development would cost you.
Frequently Asked Questions (FAQs)
Ques. How many trips does Uber do a day?
Ans. To be precise, Uber globally completes over 15 million rides per day. This is a massive number in comparison to Uber’s competitors.
Ques. How many drivers does Uber have in the US?
Ans. There were approximately 3 million Uber drivers in the US in 2018. After witnessing the continued growth of Uber, this count is expected to reach 5.1 million by the end of 2019.
Ques. How many riders does Uber have?
Ans. According to some reports, there are 75 million Uber riders globally. With Uber expanding to different countries, this number is likely to increase.
Ques. How much taxes do Uber drivers pay?
Ans. An Uber driver pays 15.3 percent SECA tax on 92.35 percent of his net self-employment income.
Ques. What cities do Uber drivers make the most money?
Ans. Among others, there are three cities in total where Uber drivers makes the most money; which are- San Francisco, New York, and San Jose.
strategies your digital product..