The success story of Google is not unknown to the world. Their services are used and loved worldwide. In this article, we will be analyzing top Google Play Store statistics 2019-2020, and how it’s impacting the lives of users and businesses across the globe.
There is never a dull moment when it comes to technology and it promises to thrive, for as long as we can imagine. What started from the first invention of the Wheel, has today come so far that everything we wish to do or to have is now a click or a tap away.
Engineers of immense capability introduced Mobile App Development, which changed the world as we know it. With the advent of apps, many minds rose to take the initiative of developing this domain to a higher level. Google is one such player that revolutionized Tech Industry is many ways. It’s products made all the difference.
What started as the “Android Market” is now famously recognized as “Google Play Store”.
Not that you don’t already know, but let us put it out there anyways – Google Play store is the Digital Distribution Service, provided by Google LLC. It is a platform that enables Android mobile users to download apps directly from the store. These apps can range from 10MB to up to 4GB.
You wouldn’t be short on the variety of mobile applications as there are millions of apps to try. Moreover, the Google Play Store poses as a remarkable platform for Android app developers to showcase their projects and get wider customer reach. In short, Google Play Store is ideal for both application users and creators.
(Note: Know how to get your app featured in Play Store)
To support the above-mentioned statement, let us look at some impeccable and top Google Play Store Statistics 2019-2020, which will blow your mind and give you a clearer perspective about the state of Google Play Store in the Tech Industry and market.
There are currently 2.7 billion smartphone users and are estimated to reach 3 Billion by the end of 2020, we are bound to increase the number of apps developed by the day.
Here are the most-awaited and interesting top Google Play Store Statistics 2019-2020
1. Total Number of Apps on Google Play Store
Google is one of the most trusted platforms and is used by millions of users on a daily basis. Due to this popularity, app developers have started to utilize this platform. This is why there is an increase in the number of apps on the Play Store.
This process of using Google Play Store to its full extent, has based the answer off how many apps are in Google Play Store, to an average of 2,714,499. According to research by AppBrain, this number is predicted to rise further by the end of 2022.
2. Total Number of Apps Released per Week and Month
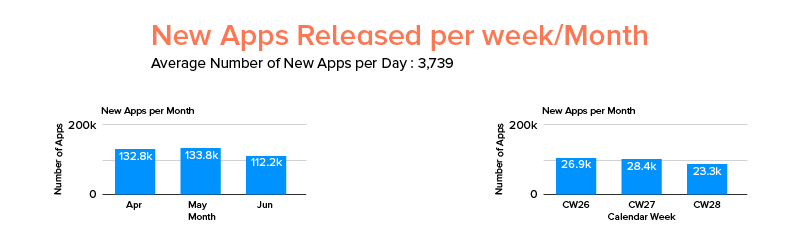
There are no speed breakers on the road to increasing demand for mobile apps. To be precise, 3739 apps are added to Play Store every day! It may seem a non-significant number when we talk about apps in billions, however, this number does add up and leads to a significant amount of increased number of mobile apps. The effects of this will be impossible to ignore in 2022.
3. Total Number of Apps Downloaded Daily
As there is a high demand for apps of every category and niche, the number of downloads per day has also increased in the last two years. It is also because the market has seen a rapid increase in the demand for smartphones.
In a report by Sensor Tower looking into top Google Play Store statistics 2019-2020, they estimated the number of downloads per day to be 250 million.
4. Total Number of Apps With and Without Ratings
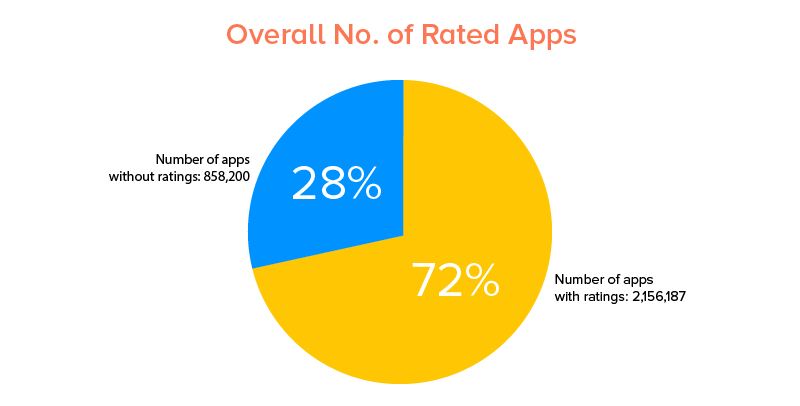
Having an idea on the apps is incredibly helpful for users to know whether the app is worth a try or not. It is calculated that there are 2,156,187 apps that have ratings on them and 8,58,200 apps with no ratings at all. By enabling people to rate apps on Play Store, Google has facilitated the users along with the developers to improvise in case their apps have poor ratings (a step to achieve which is Play Store Optimization).
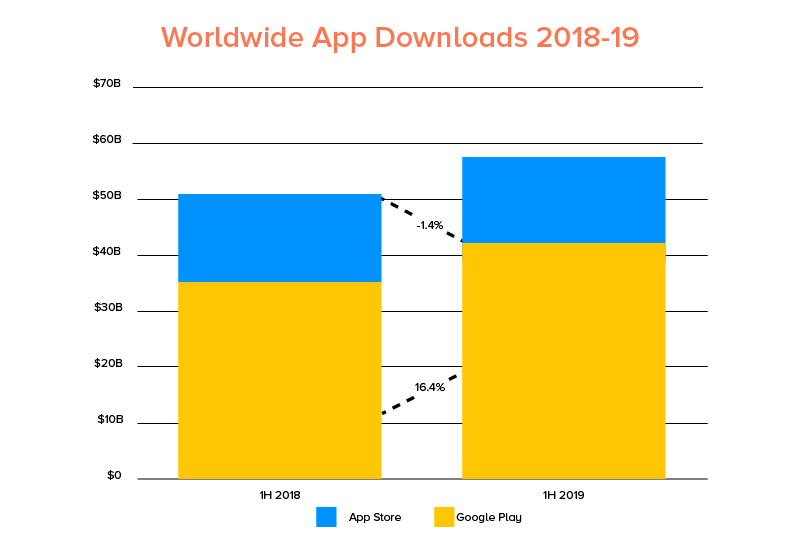
5. Google Play vs App Store Downloads
The popularity of Google Play is inevitably noticeable, as it has witnessed a hike of 16.4%from 2016 to 2018. Meaning, in the first half of 2019, the amount of the total number of installs reached 41.9 billion which is certainly an upgrade from the previous year’s number of 36 billion. Have a look at the graph containing Apple App store statistics in comparison to the Google Play Store facts 2019-2020.
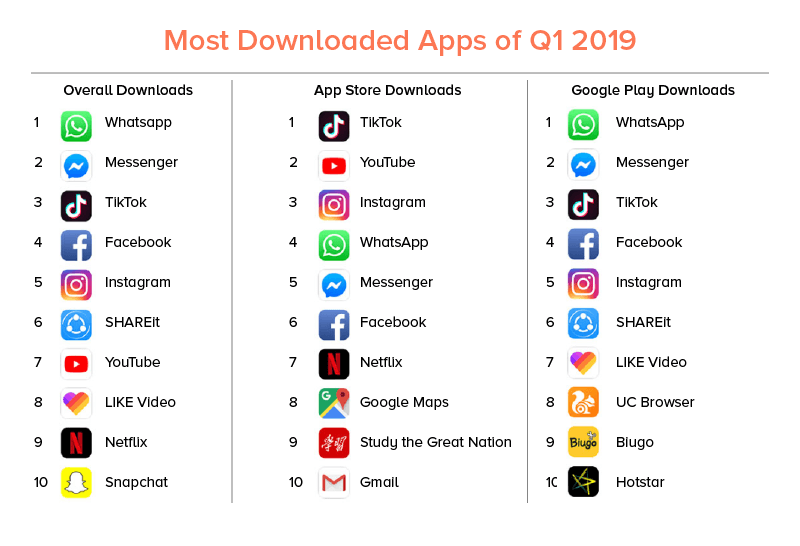
Speaking of the hike in downloads, Facebook, WhatsApp, and Messenger are the topmost apps with the combined downloads of approx 880.4 million. Meanwhile, TikTok beats Instagram on repeat.
6. Price Distribution
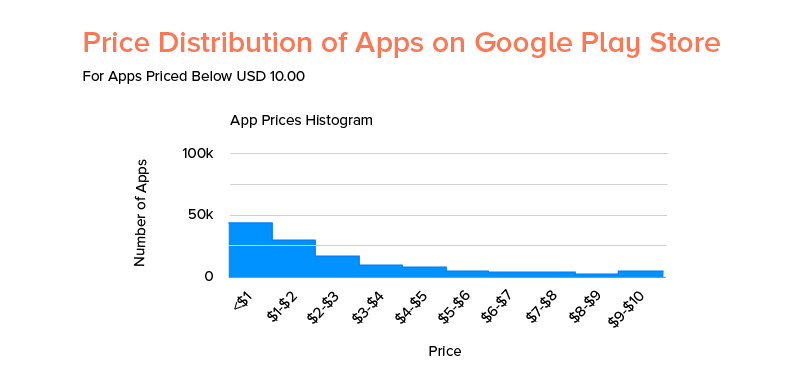
As you can see in the histogram, the average price of an app in the Play Store is between $1 to $2. This data is accumulated on the basis of apps under the price of $10. To be more eloquent, there are approx 44000+ apps under $1, and these are the apps that are preferred by the users, once they experienced the free model of an application.
Free and Paid App Download Statistics
Apps in general consist of two kinds – Paid and Free Apps. According to some research, Apple App Store has more paid apps in comparison to Google Play Store. The reason is because apple users tend to make more in-app purchases, something that is the one concrete reason why startups choose the former in their Android vs iOS choice. We have procured top Google Play Store statistics 2019-2020 in order to dissect the basics of app distribution in these formerly mentioned categories.
7. Free Android Apps
According to Android and Google Play statista, there are currently 2,589,804 free apps on Play Store, which evidently makes the majority of the apps. If you are wondering, how can developers earn revenue when the apps are free? After all, earning money is the whole point right?
Well, you might be surprised to know that most of the revenue earned by mobile apps comes from free apps by app monetization strategies like in-app purchases, which is equivalent to 98% of app revenue worldwide. This overwhelming amount of free apps on the Play Store signifies a major shift towards the freemium model. This is the reason why people prefer to develop Android apps.
8. Paid Android Apps
If we talk about Paid apps on a personal level, you hardly might be having 2 paid apps on your device, isn’t it? However, if you say otherwise then you belong to the minority of the paid app demographic. Currently, there are over 1,25,894 paid apps on Google Play Store according to Statista. This amount leads to 4.6% of total apps, as shown in the graph above.
Google Play Stats for Mobile App Usage
Generation X is technology dependent generation, mobile apps in particular. There are apps to do everything instantly. Under the light of this statement, we would like to add that almost 21% of millennials open apps 50+ times a day and 49% of overall smartphone demographic open an app 11+ times per day.
Moreover, it is noted that an average smartphone user uses 30 apps each month, if not more. These facts are potential enough to convince you of the increasing usage of mobile apps, especially on the Google Platform. Read some more points on how these apps are performing under different demographics and conditions.
9. Global Usage of Play Store Apps
Around 50% of the world’s population which is equivalent to 3.9 billion people, were determined to be online in 2018, and 96% of the world’s population lives within the expanse of a mobile network.
It was estimated that there were over 4 billion mobile devices being used in 2018, with the majority of demographics in mature markets having several devices.
It is to be noted that many emerging markets like India and the Philippines comes under the mobile-first category. This signifies that in these markets, consumers use smartphones as their primary access point to the internet. Moreover, according to top Google Play Store statistics, the majority of the apps downloaded are for the Android platform.
It is needless to say that since everything is at the fingertips now, the usage limit of apps and smartphones is bound to increase by multi-folds, as it is evident as the time spent using apps globally grew to 50% from 2016 to 2018.
With that said, it is safe to say that people around the world are becoming more aware and an avid user of technology. We have categorized the app usage and download count below for hassle-free understanding.
10. App Usage by Age
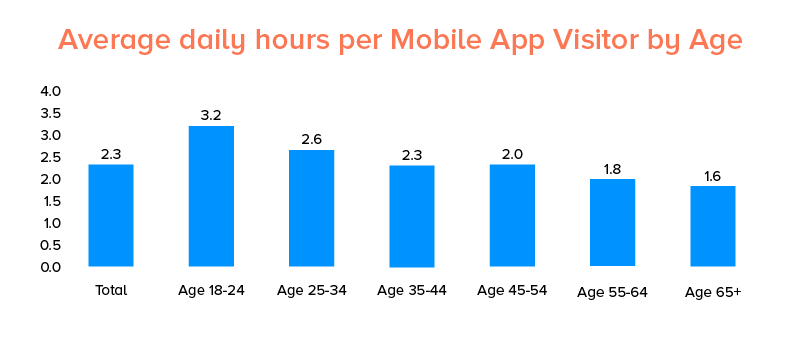
It is generally assumed that younger generations, by default, spend more time using mobile apps than the people of the older generation. There is no denying that generation X since the start has seen the technology all around, so they are more involved with the tech trends.
Nevertheless, that doesn’t mean you can’t target the rest of the age groups. If you look at the graph, you would find the app usage statistics looking at the frequency at which apps are opened daily by people belonging to different age brackets.
This study of the US shows that Millennials open apps most frequently – averaging at 10.5 times per day (considering Millennials as 18-34-year-olds). After them comes teens, at 9.4 times per day, which is nevertheless, predicted to increase. And to our no surprise, Boomers come out last by this measure, at 5.5 times a day.
Now, to sum up, on an average, US app users of age 13-64 open apps 8.3 times per day.
11. Usage by Devices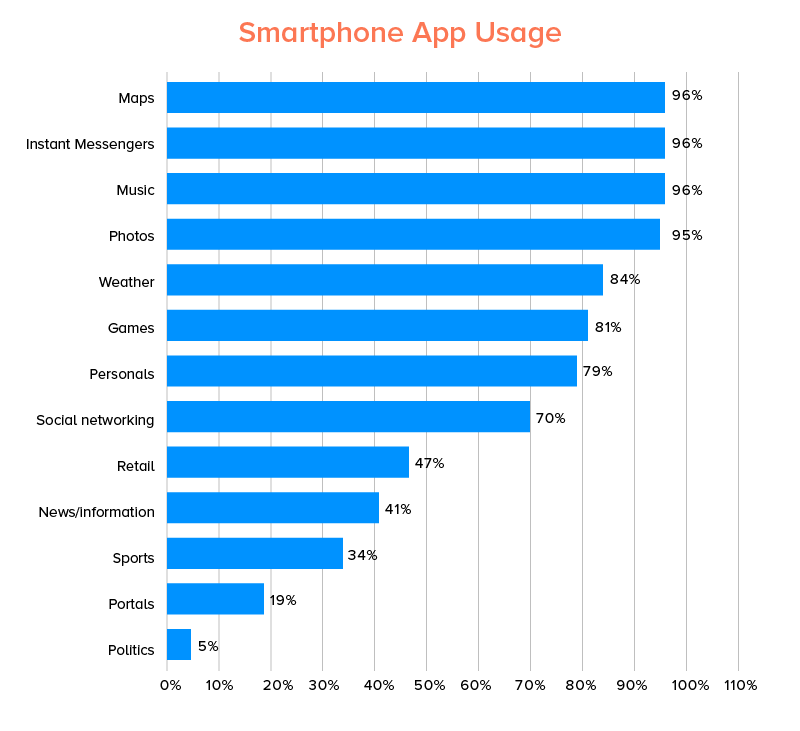
Now, that one is not bound to any one device to access the internet, people use numerous Android devices like Tablets, Smartphones, Laptops, desktops and so on. However, some research shows that there are some specific app categories that have a high usage rate in Smartphones. Those applications include Maps, Instant messengers, Music, Games, photos, weather, etc.
Whereas, if we talk about Desktops, their preference rate is still maintained. It is probably the result of their incredible specifics that prove ideal for certain purposes.
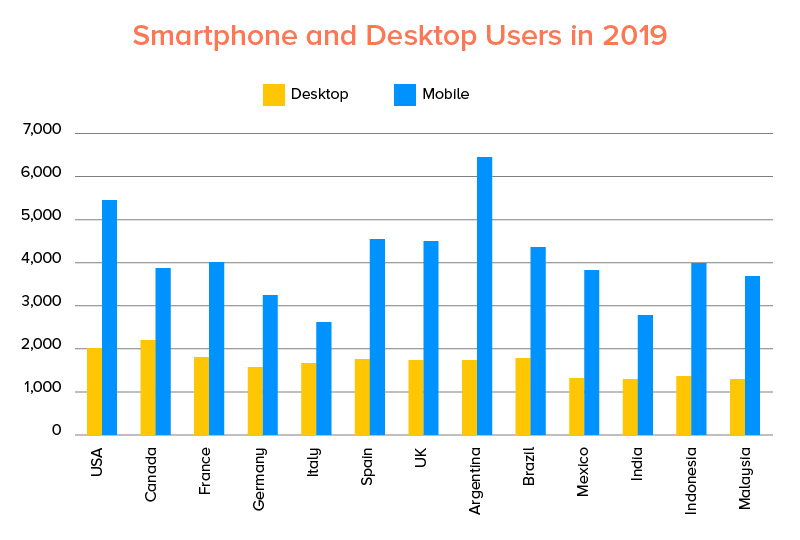
According to Comscore’s Digital Future in Focus 2018 report, the time used on mobile in selected global markets has increased. According to the statistics mentioned below, the highest amount of mobile time spent is noticed in Argentina, accompanied by the US, and Spain. Whereas, Italy, India, and Germany can be seen at the lowest in the usage.
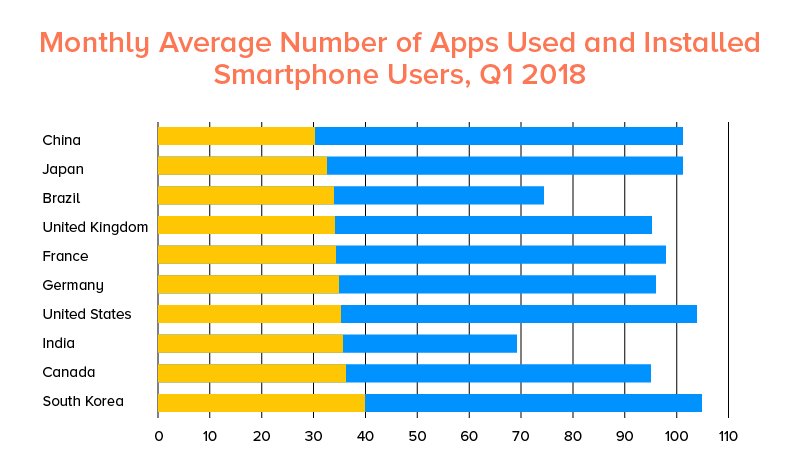
12. Usage by Country
Like nearly everything else, location changes the behavior that changes the statistics and condition of things. This same concept is apt to be applied to app usage.
Let’s take a look at the top Google Play Store statistics 2019 to 2020 and analyze how people in different parts of the world like to use mobile apps. This information can be used by developers to learn about the audience they intend to target and potential markets which can prove to be beneficial while planning the app localization strategies.
South Korea was at the top of apps used and installed on a monthly average, followed by the US and Japan.
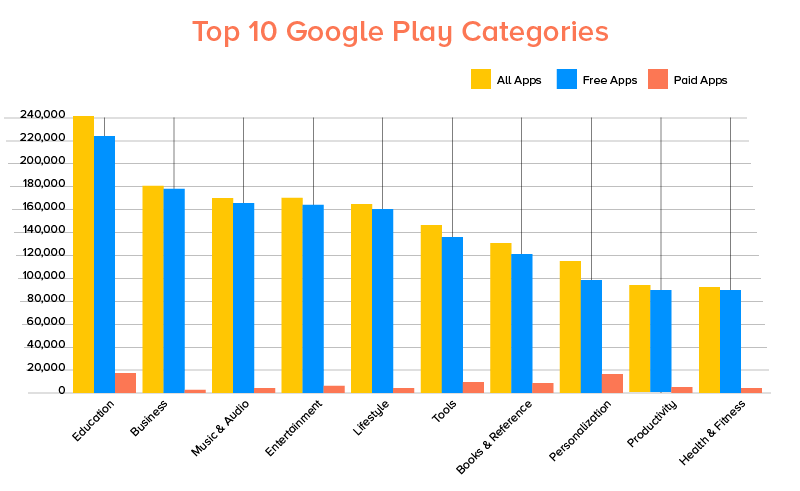
Most Popular Apps Categories in Google Play
According to AppBrain, some categories have a higher penetration rate than the others. Google Play Store Market Data shows that Education apps have the highest rate in popularity in Google Play Store. It is followed by the Business app categories. In the graph below, you can see the number of paid and free apps in the Play Store, that are popular due to their high download rate.
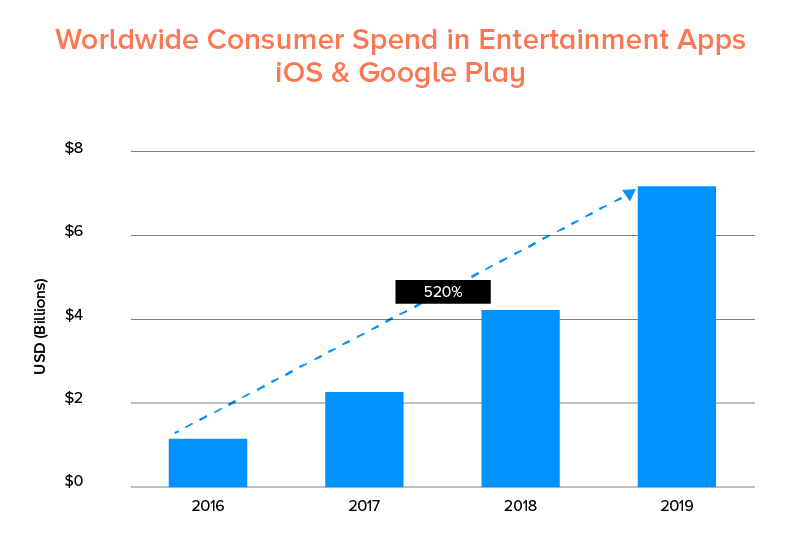
13. Popularity of Entertainment apps
In the research by AppAnnie, 1/6 of the total media content used by users will comprise online videos viewed on mobile device screens in 2019 to 2020. This fact is enough to make us believe the increasing demand and usage of this particular category, especially in the Play Store. The hike rate has tremendously increased as shown in the graph below.
14. Popularity of Gaming Apps
It is estimated that, as of 2018, there were 2.2 billion mobile gamers in the world. 203 million mobile gamers were based in the US, and 459 million in China. This ever increasing number surely brings in tons of revenue for Google Play Store. As the popularity of the gaming app is on a hike, the average revenue is also predicted to rise at an incredible rate.
The amount of spending increased by 11.3% year-over-year, only in the first half of 2019 reaching $29.6 billion across the iOS App Store and Google Play. Due to this, Google Play game spending grew by 16.8% to $12 billion. This estimation amount is likely to be increased by 2022.
Here is the list of top Non-Game apps which have turned the world upside down and everybody is under the influence of their popularity, uniqueness, and utilitarian features.
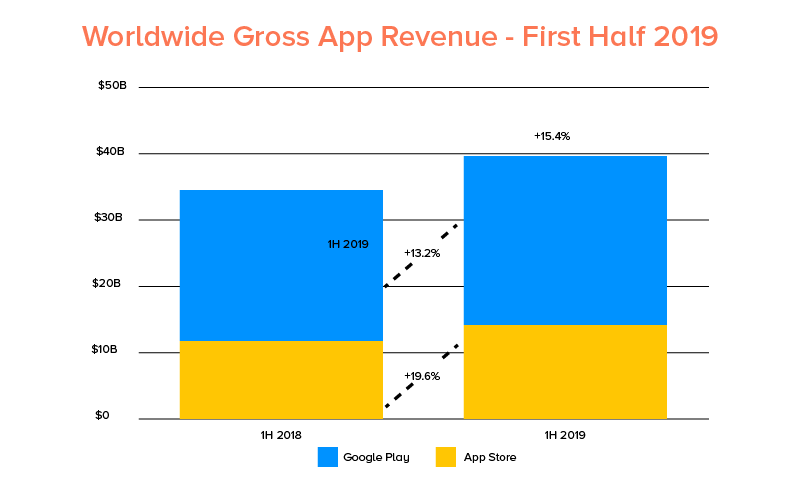
15. Gross App Revenue
From a report by Sensor Tower, we acknowledged that the iOS App Store and Google Play combined produced $39.7 billion in worldwide app revenue, just in the first half of 2019 — and that’s up 15.4% over the $34.4 billion of what was made during the first half of last year.
Report on Google Play Store revenue says that $34.4 billion of last year was a 27.8% increase from 2017’s numbers, then a combined $26.9 billion across both stores. So, you see how these Google Play Store economy stats are improving every year. In this case, we will not be wrong to expect the Google store to surpass Apple store numbers.
Additional Play Store App Usage Trends
Since mobile applications are at the peak of their popularity, we have come across some interesting and mind-blowing statistics. Here are some of the many trends and stats of mobile apps in the Google Play Store that may interest you:
- There are 15 million subscribers on Youtube and Google Play Music combined.
- In 2018, users spent $25 billion on Google Play purchases.
- Approximately 49% of game players of Google play games are women.
- The number of apps scanned daily by Play Store for safety is nearly 6 billion.
- Google Play Store has successfully established its presence in 190 countries, which is pretty impressive and signifies continuous success.
- Google Play Store has an impressive collection of 40 million songs to date.
- Google Play Store facts 2019 to 2020 suggest that Candy Crush Saga is the top most installed game.
- The number of obsolete apps removed by Google from the Play Store was near to 7,00,000.
Conclusion
Once you go through the top Google Play Store statistics 2019-2020, you would find yourself convinced of the rising splendor not just of Google but also of all the Android apps operating in the store. Google has immersed the lives of the people with its services and market with its business model and innovative ideas.
Not just this, but its popularity is owed to its activeness in making its services reliable and safe. The latest example is the Google Play Store policy update, where the previously prevailing issues were encountered.
Though, it might seem that Apple is a notch higher than Google, as per the statistics and researches by some leading and celebrated Research agencies, one cannot deny the long-due inevitability of Google ruling the IT industry and market as its user base increases per day, globally.
Frequently Asked Questions (FAQs)
1. How can I see how many downloads I have on Google Play?
Google offers its services for almost all tech related purposes. If you want to see the total number of downloads and other information related to your app then, you can use Google Play Console. This is how to achieve it-
- The first thing is to Login to your google Play Console.
- Click on “Life time” on the dashboard of your application, which is placed at the top right corner.
- Here, you can see Installs, Uninstall done by user, Average rating, Crashes, ANRs, and more.
- You must select “Export Report” option for more statistics. It is at bottom right of the respective category card.
2. How many apps does Google Play have?
You will be shocked to know that there are 2,714,499 apps currently at the Google Play Store. This number is on a rise as 3739 apps are added to the Play Store ever single day.
3. How much does it cost to put an app on the Play Store?
On an average, it can cost you about $25, which Google charges as a one-time registration fee.
4. How much money do apps make per download?
There is not any specific number as to how much money every app makes, as each app appeals to different demographic and have a distinct reach. However, an average estimated rate for a $1 app to earn $10 a day is to have at least 10 downloads.
5. What apps make the most money?
The answer to this question is not as simple as a straight line. It may vary depending on what kind of app it is. However, it is certain that apps which are different than their competitive apps have more chances to be popular and hence, make money. Some of the apps which made money this year are Spotify, Line, Tinder, HBO NOW and more.
6. How much does an app with 1 million downloads make?
Earning a million downloads is not as easy as shelling peas. However, if you app becomes that popular and manages to procure 1 Million downloads, then you can earn between $10000 to $15000 per month, which is a pretty neat amount.
strategies your digital product.